What Is Regression to the Mean?
5 min read≈ 1,130 words3 questions · up to 3 points
What this is about
Why would a flight instructor be right that shouting is followed by better flights and still be wrong about shouting? You learn what regression to the mean is, how Francis Galton measured it in the heights of 205 families, and why it makes praise look useless and bad remedies look good. You also learn the two ways people misread it.
In a nutshell· skip ahead
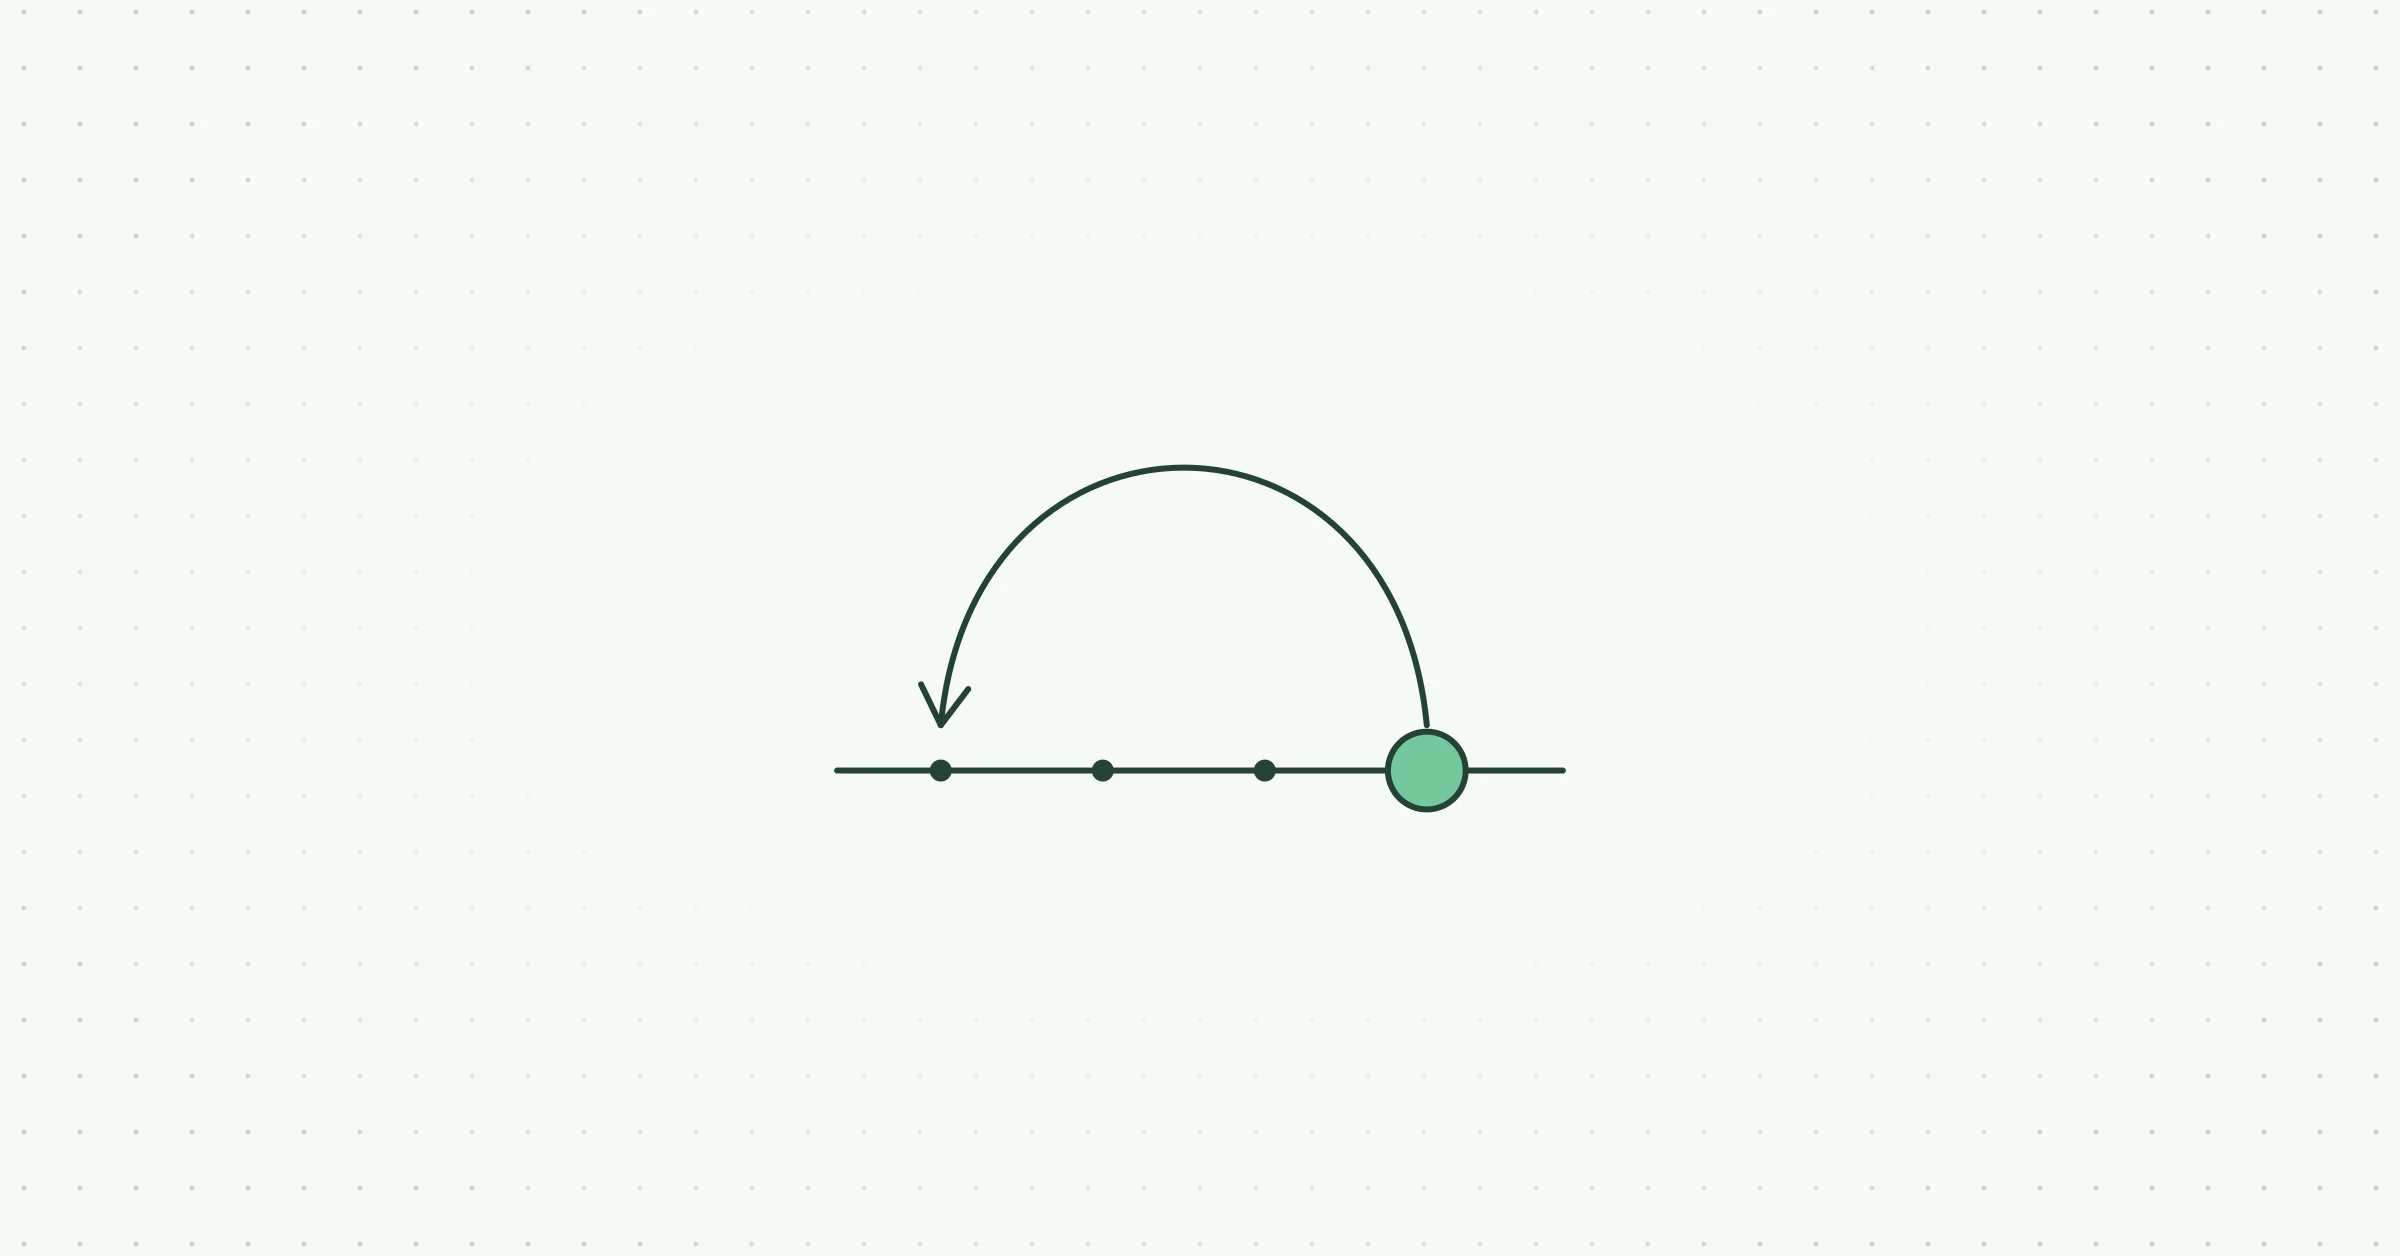
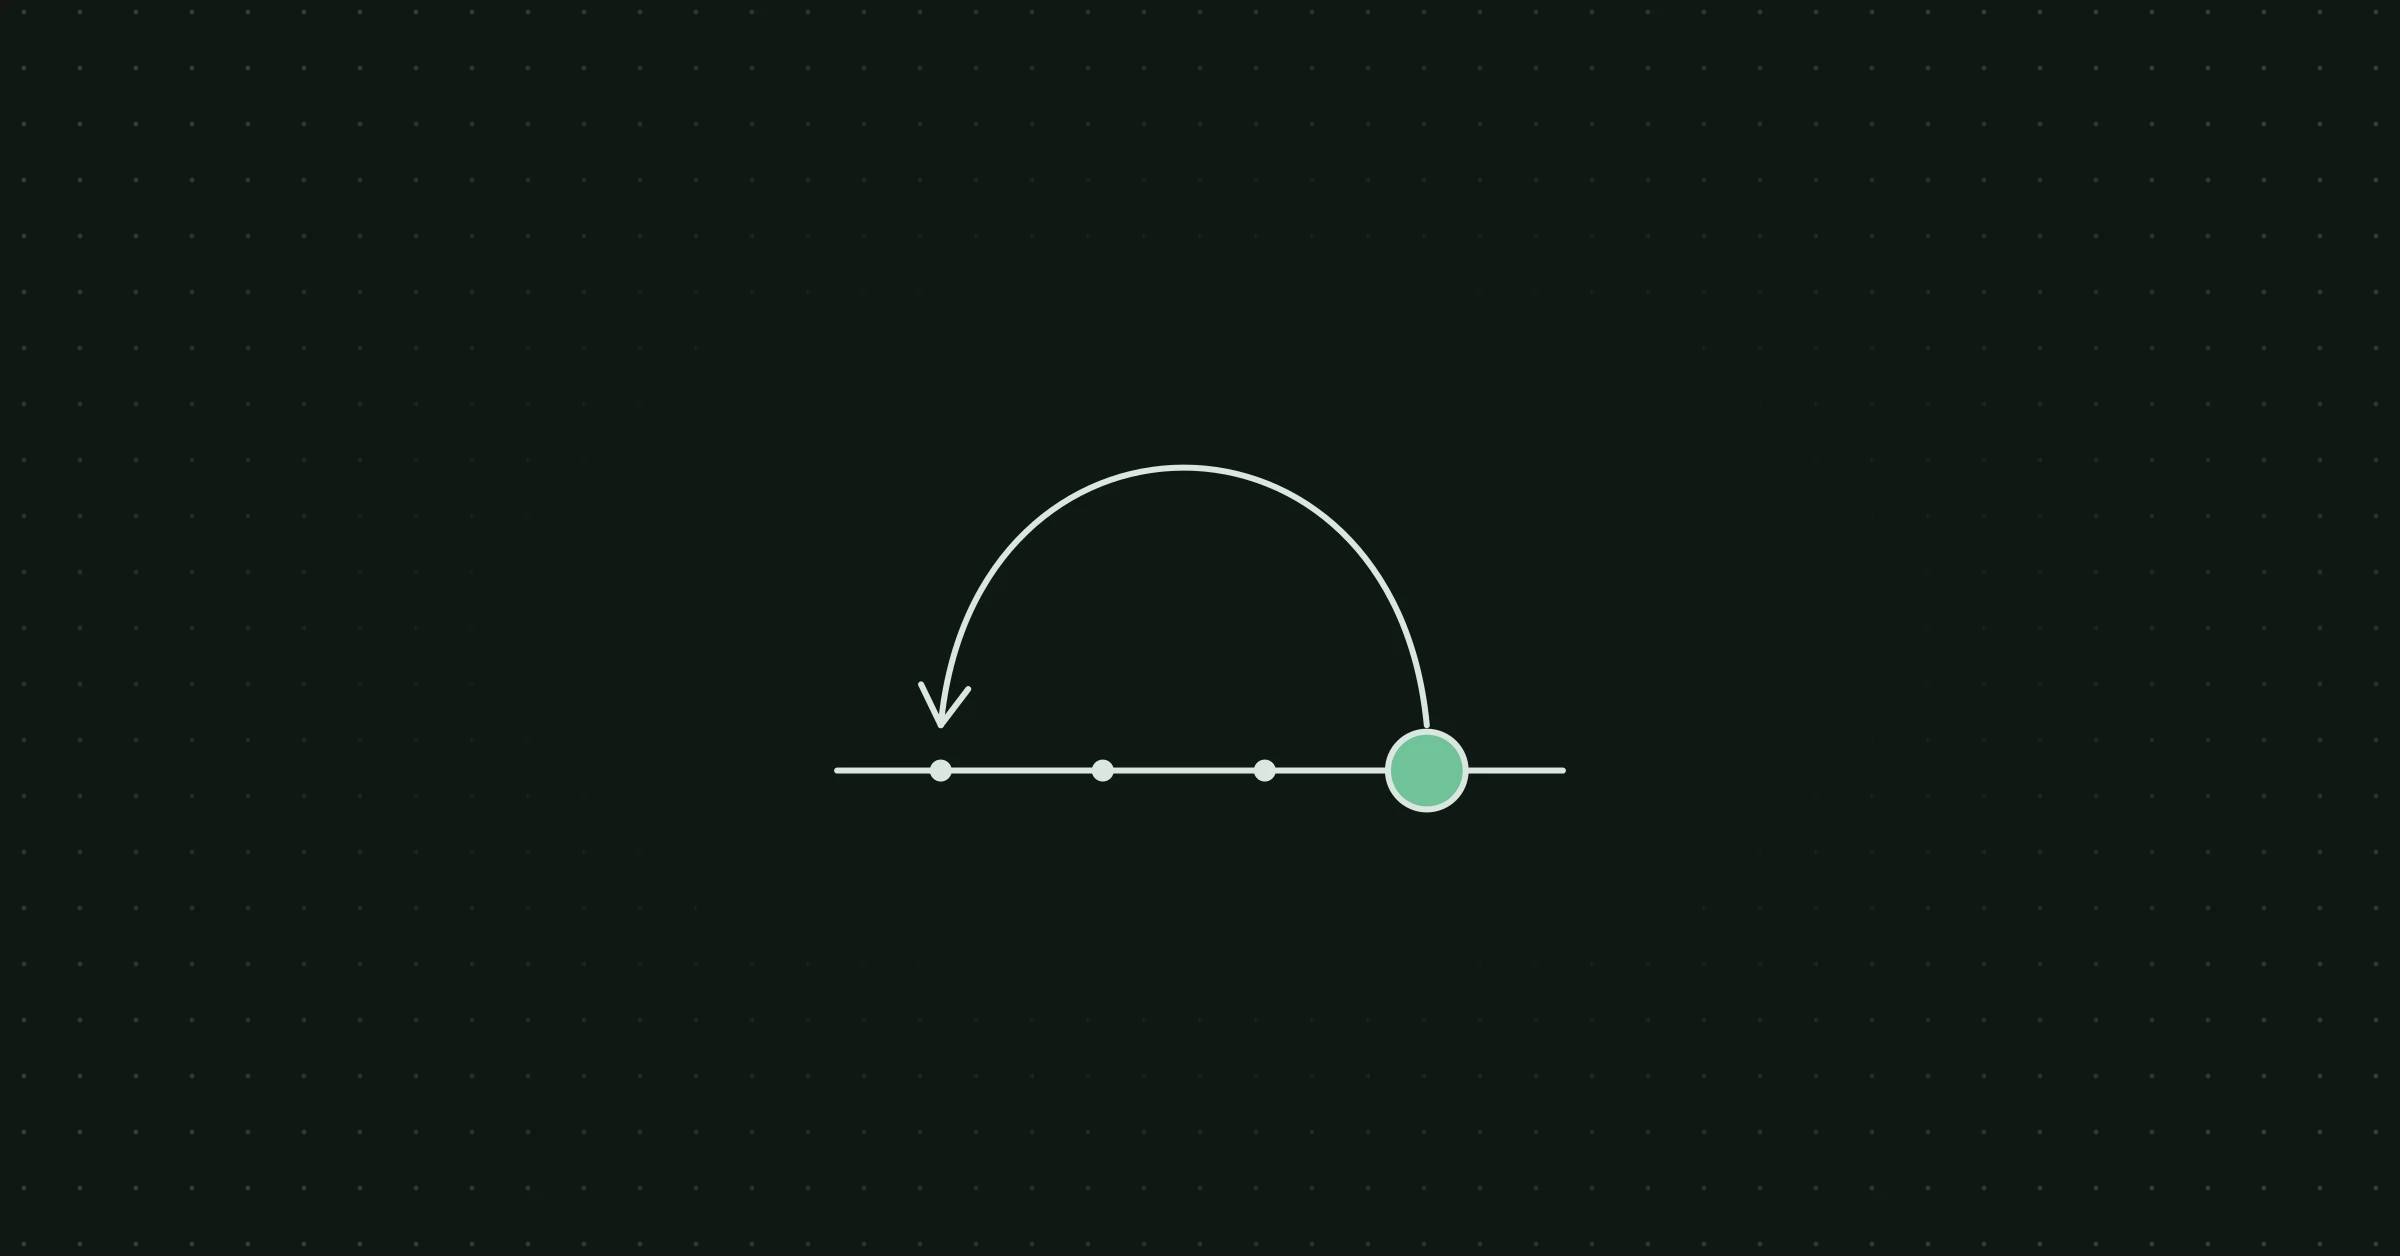
Regression to the mean means that when a result is unusually far from the average, the next result of the same kind is usually closer to it. This happens whenever results depend partly on lasting qualities and partly on chance, because the chance part of an extreme result is rarely repeated. It is a statistical effect, not a cause.
In the 1960s the psychologist Daniel Kahneman was teaching flight instructors in the Israeli Air Force that praise works better than punishment, when one experienced instructor disagreed. When he praised a cadet for a clean manoeuvre, he said, the next attempt was usually worse, and when he shouted at a cadet after a bad one, the next attempt was usually better. Kahneman believed the instructor’s observation but not his conclusion that shouting works. How can a true observation lead to a false lesson?
What is regression to the mean?
The explanation is regression to the mean, also called reversion to the mean. When a result is unusually far from the average (in statistics, the “mean”), the next result of the same kind is usually closer to the average, whatever happens in between. The effect appears whenever a result depends partly on lasting qualities and partly on chance. The instructor always reacted to extremes, praising the best flights and shouting at the worst, and extremes are rarely repeated.
To see why, think of each flight as two parts added together. One is the cadet’s real skill, which stays about the same from day to day, and the other is luck, such as a gust of wind, which changes every time. An excellent flight usually means that good skill and good luck came together. On the next flight the skill is still there, but the luck is new, and new luck is on average ordinary, so the result falls back toward the cadet’s usual level. A terrible flight works the same way in reverse, so the cadets improved after being shouted at even if the shouting did nothing.
What did Galton find in the heights of 205 families?
The effect was first measured by the English scientist Francis Galton. In the 1880s he collected the heights of 205 pairs of parents and 930 of their adult children.
- The average. Galton averaged each father’s and mother’s height into a “mid-parent”, after multiplying women’s heights by 1.08 to compare them with men’s. The average adult in his data was 68¼ inches tall, about 173 centimetres.
- The finding. On average, a child stood only about two-thirds as far from the average as the mid-parent. If the parents were 3 inches above average, their children were on average about 2 inches above it. Children of short parents were short, but also closer to the average.
- The reason. Height comes partly from inheritance and partly from chance, such as illness, food in childhood and the random mix of genes each child receives. Very tall parents are often very tall partly because of such chance, and that part is not passed on.
Galton also noticed, to most people’s surprise, that the effect works backwards as well. If you start with very tall adults and look at their parents, the parents are on average closer to the average than their children. So regression is not nature pulling people back, but a result of how we pick the cases: whenever we select something for being extreme, we also select some luck.
What regression to the mean teaches you
Before you credit or blame a cause, ask whether you were reacting to an unusual high or low and whether the result would have moved back toward normal anyway.
- Praise and criticism. Managers, coaches, teachers and parents usually react to unusual results, praise after a peak and criticism after a low point. So they keep seeing criticism followed by improvement and praise followed by decline, and they learn the wrong lesson, as the flight instructor did.
- Health. People try a new remedy when their back pain or their cold is at its worst, which is exactly when it is most likely to get better on its own. This is a main reason why medical trials compare a treated group with an untreated control group, and the same logic applies when a school or a town tests a new programme on its worst cases.
- Money and hiring. The fund with last year’s best return or the salesperson with last year’s record result was probably good and lucky at once. Before you invest or promote, ask how much of the result can be repeated.
Does everything drift toward the average?
No, and believing so is the first common misreading. In 1933 the American economist Horace Secrist published The Triumph of Mediocrity in Business. He found that the most profitable firms of one year later became less profitable while the least profitable ones improved, and he concluded that competition pushes all firms toward mediocrity. The statistician Harold Hotelling pointed out in a review that Secrist’s method of grouping the firms guaranteed this result. Regression moves individual firms, but other firms become extreme by chance, so the differences between firms do not shrink, just as every generation in Galton’s data has as many very tall people as the last.
The second misreading treats regression as a force that balances things out. After a coin shows heads five times, the next toss is still fifty-fifty. Regression only says that the next ten tosses will be ordinary on average, not that tails will now catch up. That mistaken belief is called the gambler’s fallacy.
Finally, the size of the effect depends on how much chance there is: an adult’s height measured twice shows almost no regression, while a result that is pure luck falls all the way back to the average. Regression also leads back to each case’s own average, so a top athlete after a great season falls back toward their own level, not to the level of an average player. Nor does regression prove that the praise or the new programme had no effect, only that a simple before-and-after comparison cannot tell.
Learn more
The idea has a clear father: Francis Galton (1822 to 1911), a half-cousin of Charles Darwin. He first saw the effect in sweet pea seeds that he sent to several friends to grow, and in a lecture at the Royal Institution in London in 1877 he described the offspring as “reverting” toward the average. In his 1886 paper on the heights of families he called it “regression towards mediocrity”, the first reference below. His follower Karl Pearson turned this work into the statistics of correlation.
The flight instructors appear in “Thinking, Fast and Slow” by Daniel Kahneman: Summary and Review. What Is an After-Action Review? shows a method for asking what really caused a result. For a readable book on luck in everyday life, try The Drunkard’s Walk (Affiliate Link) by Leonard Mlodinow.
Quiz
3 questions · up to 3 points
Open a question and pick one answer. Only your first answer counts: +1 if it is right, −1 if it is wrong.
Why did cadets usually fly worse after their instructor praised them?
Show answer
Praise followed their best flights, which included good luck that was unlikely to repeat. The instructor reacted to extreme results, and the next flight was likely to be closer to the cadet's usual level whatever he said.
A school gives extra tutoring to the ten classes with the worst test scores, and next year their scores rise. What should you conclude?
Show answer
Nothing yet, until you compare with similar low-scoring classes that did not get the tutoring. Classes chosen for an extremely low score would likely improve anyway, so only a comparison group shows what the tutoring added.
Children of very tall parents are usually shorter than their parents. Why does this not make everyone the same height over the generations?
Show answer
Some children of ordinary parents become very tall by chance, so the spread of heights stays the same. Regression describes individual families, not the whole population. New extremes appear every generation, so the spread does not shrink.
Your points are saved only in this browser for now. Accounts that keep them for good are on the way.
Continue learning: "Thinking, Fast and Slow" by Daniel Kahneman: Summary and Review →The takeaway
Regression to the mean means that an unusually high or low result is usually followed by a more ordinary one, because extreme results often contain luck that does not repeat. Francis Galton measured it in 1886: children of very tall parents were on average only two-thirds as far above the average as their parents. It does not make everything average over time or predict the next coin toss. Before you credit a cause for an improvement after a low point, compare with a similar case where nothing was done.
References
- Regression towards Mediocrity in Hereditary Stature. Francis Galton, Journal of the Anthropological Institute 15, transcribed by the University of York, 1886
Galton's original paper with the height data of 205 families, the two-thirds rule and the earlier sweet pea experiment.
- Regression to the mean: what it is and how to deal with it. Adrian G. Barnett, Jolieke C. van der Pols and Annette J. Dobson, International Journal of Epidemiology 34 (1), 2005
A short guide for medical researchers on how the effect distorts health studies and how good study design prevents it.